※ Clicking on the underlined text will display the relevant Data or photos.
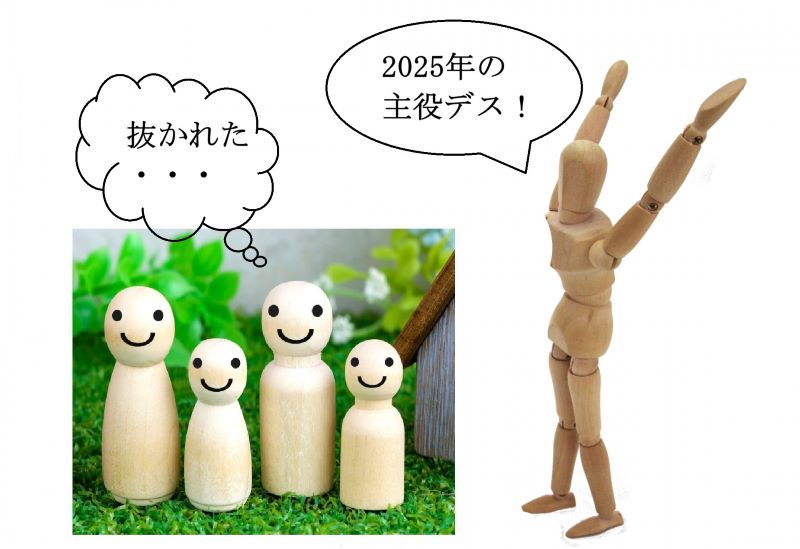
The Ministry of Internal Affairs and Communications released the ‘2025 Family Income and Expenditure Survey Report’. The average monthly consumption expenditure per household for households with two or more people was 314,001 yen. The nominal value (the amount consumers actually paid) went up 4.6% from last year, reflecting rising prices, marking the fifth consecutive year of increases. Also, the real value (the figure excluded for price changes) went up by 0.9% from last year. The real value tends to decline more sharply when prices soar. Therefore, it has decreased over the past two years. That turned into an increase last year. There are six expense items that increased compared to last year. In order of highest rate, it’s transportation and communication, culture and entertainment, education, utilities, healthcare, and housing(The categories that decreased are other consumer spending, clothing and footwear, food, and furniture and household goods.). The Ministry of Internal Affairs and Communications analyzed that events like the Expo 2025 Osaka, Kansai, Japan boosted spending on transportation and communication (up 9.6% nominally, 6.7% in real terms) and on culture and entertainment (up 6.2% nominally, 3.7% in real terms). Even though 2025 was a year of struggling with high prices, it was also a year for investing in improving knowledge, awareness, and academic skills.
Among them, households with two or more people spent an average of 10,563 yen per year on toys (see Table 1). The growth rate from last year is 26.5%. Purchase frequency also went up by 3.3 Frequency. From the item-by-item figures, we can see that the one driving the increase is the home game console released in June. Hidden behind that, other toys grew by 5.1% in the first half of the year and 15.7% in the second half compared to the previous year. Last year, hit products in each category pushed the share of spending on toys in the total average spending amount to 0.28%, the highest in the past 10 years (see Table 3). Last year was a year when consumers were really eager to buy hit toys. At the same time, the market saw a clear distinction in sales performance between different products.
The average annual amount that single-person households spent on toys was 13,004 yen per household (see Table 2). This amount is up 98.4% from last year, basically double the spending. The purchase frequency went up by 60 Frequency compared to last year. From the number of times, it becomes visible that it didn’t just end with buying a pricey new home game console. The proportion of toys in the total average spending amount increased to 0.63%, thanks to the heightened interest in various factors such as support activities for favorite characters (see Table 3). Spending on each item naturally goes up when prices rise. But unless consumers choose it, the share of a specific item in total average spending amount won’t go up. This shows how eager people are to buy toys these days.
2025 turned out to be the year in the past decade when Japanese people were most eager to spend on toys. What’s more, spending on toys for single-person households (13,004 yen) exceeded that of households with two or more people (10,563 yen). In 2016, the share of spending on toys in the total average spending amount was 0.19% for both households(see Table 3). However, annual spending on toys was 6,592 yen for households with two or more people, and 3,693 yen for single-person households, almost double the difference. This situation was changed by the stay-at-home demand due to the COVID-19 outbreak. The year 2025 became the year when the main toy consumers in Japan shifted from kids to adults.